Help
Spectra Prediction
The Spectra Prediction utility predicts the spectra for a given input molecule.
Submit Prediction Query
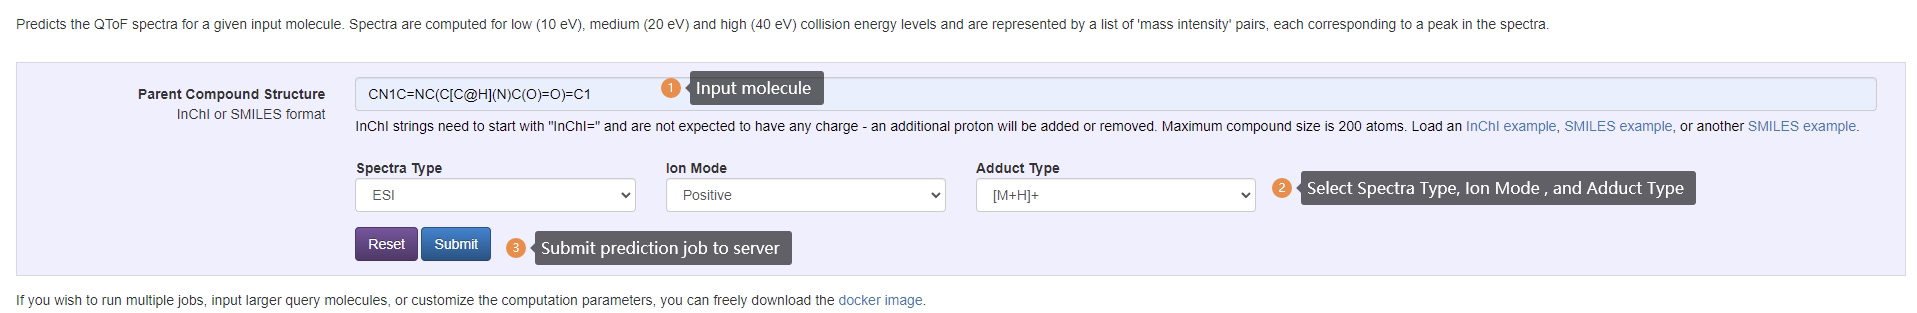
Submit Prediction Query Steps:
- Enter InChI or SMILES
- Select desired spectra type, ion mode and adduct type.
- Submit prediction job to server
Note: InChI strings need to start with "InChI=" and input molecule should not has any charges.
Defitions of Inputs:
InChI/SMILES: The molecule must be represented in either InChI format or SMILES format. InChI strings need to start with "InChI=" and are not expected to have any charge - an additional H+ will be added. InChI strings need to contain AT LEAST the main layer with its chemical formula and atom connections sublayers for proper computation.
| Examples: | CN1CCC[C@H]1c2cccnc2 |
| InChI=1S/C10H14N2/c1-12-7-3-5-10(12)9-4-2-6-11-8-9/h2,4,6,8,10H,3,5,7H2,1H3 |
Spectra Type: The type of spectra, either ESI (Electrospray Ionization) or EI (Electron Ionization/Impact).
Ion Mode: Indicates whether the precursor ion has a positive or negative adduct.
Adduct: Indicates the specific adduct used.
Spectra Prediction Results
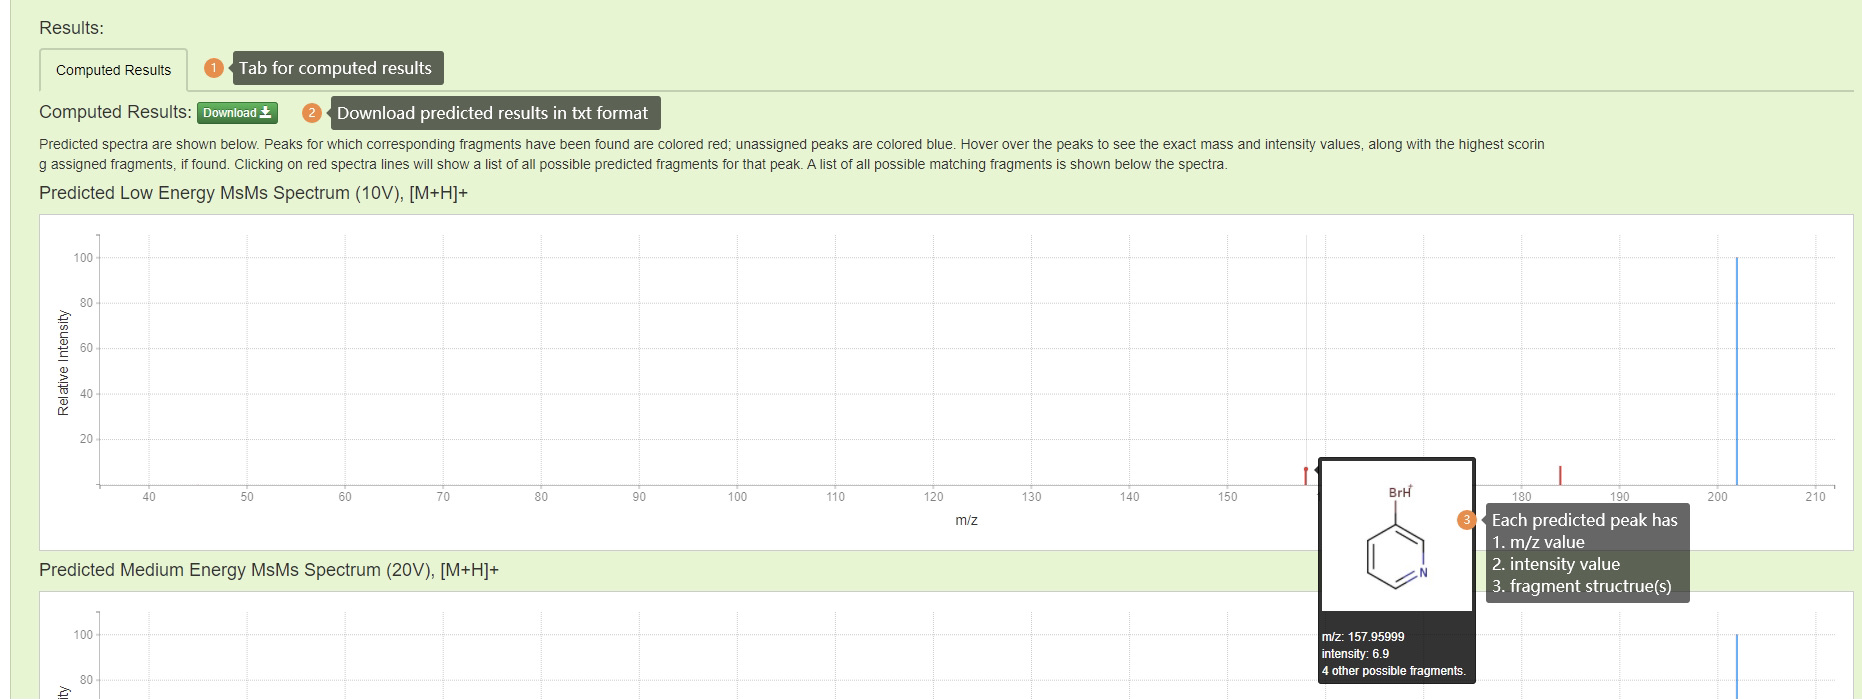
Results Part 1: Spectra are computed for low (10 eV), medium (20 eV) and high (40 eV) collision energy levels and are represented by a list of 'mass intensity' pairs, each corresponding to a peak in the spectra. Each peak in predicted spectra has a m/z value, an intensity value, and one or more possible fragment ion structure(s).
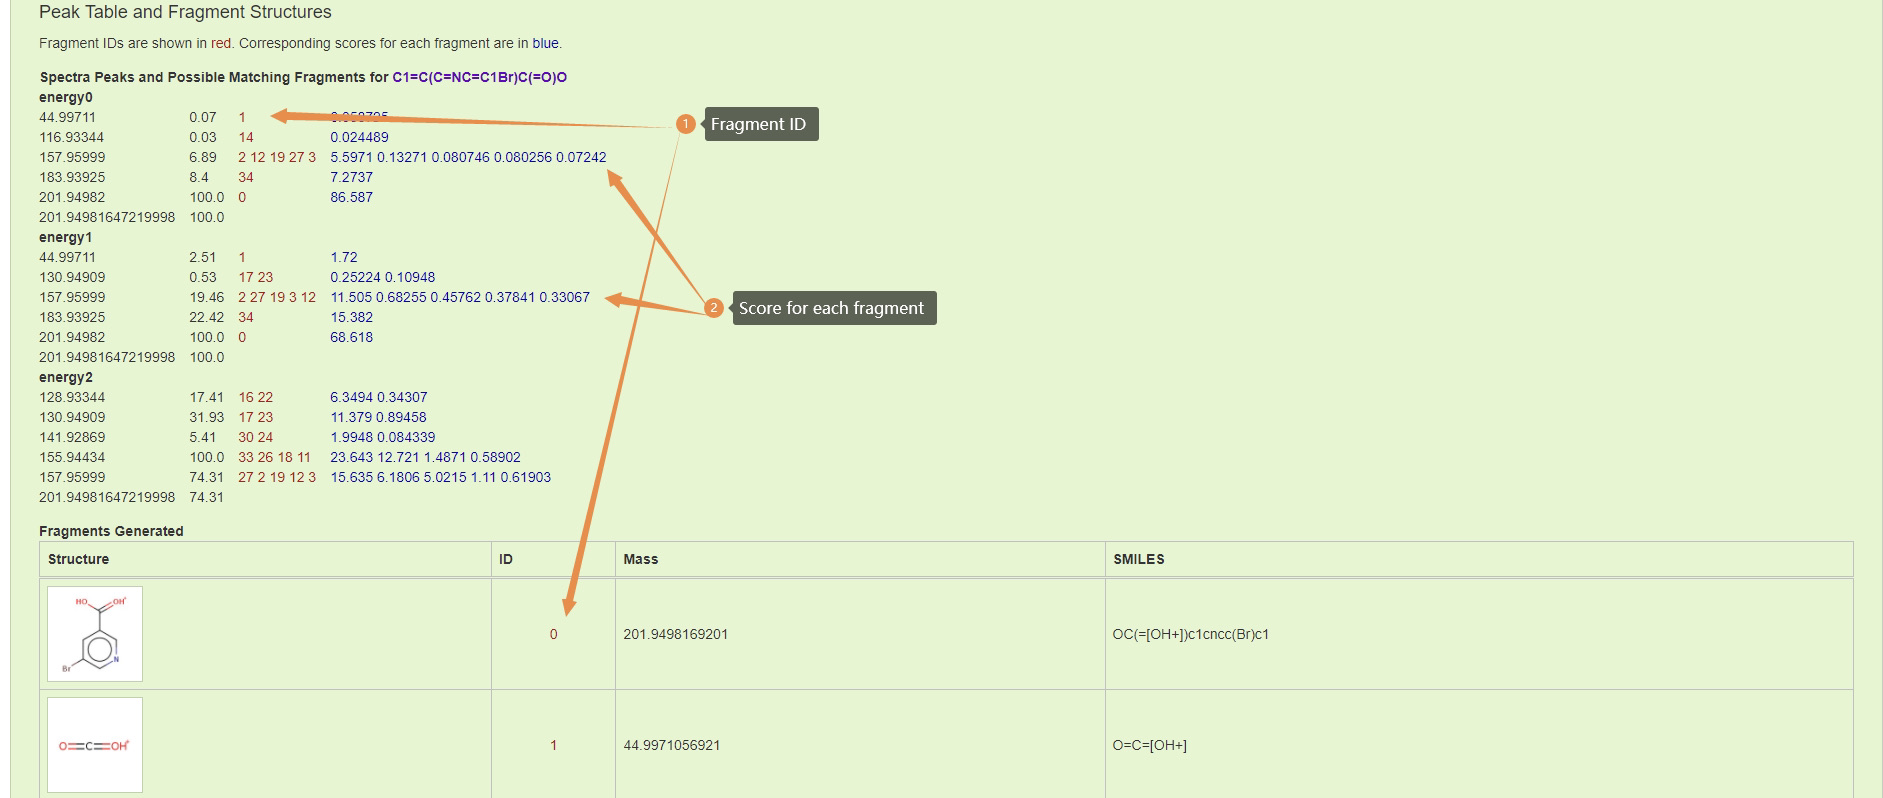
Results Part 2: A detailed list of all predicted fragment can be found down the page. Each fragment can be linked back to predicted spectra by its fragement id.
Peak Assignment
The Peak Assignment utility annotates the peaks in a provided set of spectra given a known molecule. The complete list of feasible fragments is computed, then the most likely fragments for each spectrum peak are determined using a pre-trained model.
Submit Peak Assigment Query:
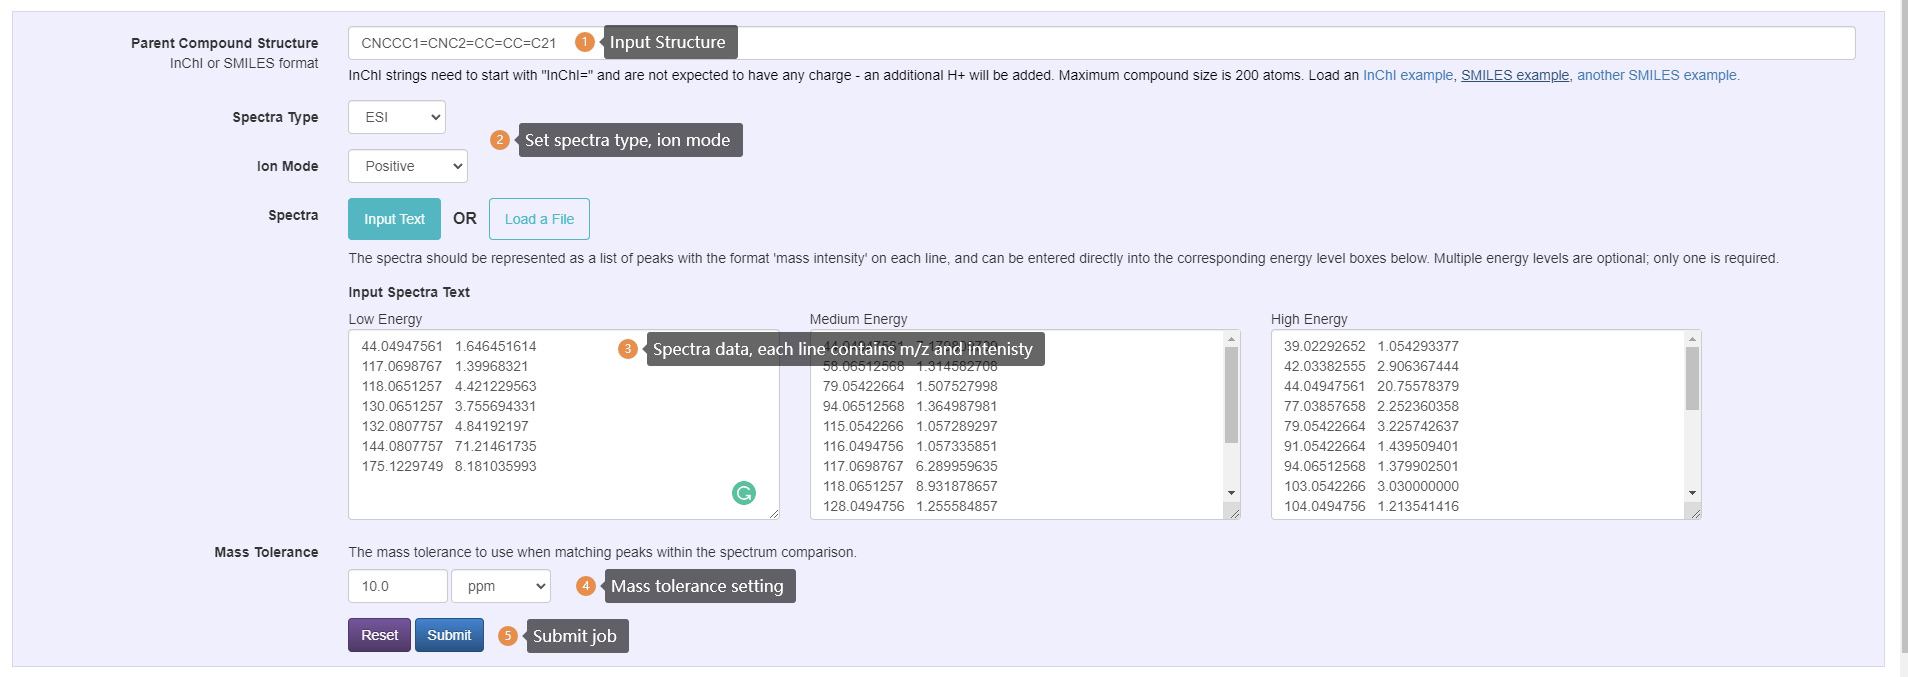
Peak Assignment Query Steps:
- Enter InChI or SMILES
- Select desired spectra type, ion mode and adduct type.
- Enter spectra data, the spectra should be represented as a list of peaks with the format 'm/z intensity' on each line. Multiple energy levels are optional; only one is required.
- Select mass tolerance to use when matching peaks within the spectrum comparison.
- Submit job to server
Defitions of Inputs:
InChI/SMILES: The molecule must be represented in either InChI format or SMILES format. InChI strings need to start with "InChI=" and are not expected to have any charge - an additional H+ will be added. InChI strings need to contain AT LEAST the main layer with its chemical formula and atom connections sublayers for proper computation.
| Examples: | Oc1ccc(CC(NC(=O)C(N)CO)C(=O)NC(CC(O)=O)C(O)=O)cc1 |
| InChI=1S/C16H21N3O8/c17-10(7-20)14(24)18-11(5-8-1-3-9(21)4-2-8)15(25)19-12(16(26)27)6-13(22)23/h1-4,10-12,20-21H,5-7,17H2,(H,18,24)(H,19,25)(H,22,23)(H,26,27) |
Spectra: The spectra should be represented as a list of peaks with the format 'mass intensity' on each line. For ESI spectra, 'low','medium', and 'high' or 'energy0', 'energy1', and 'energy2' header lines should begin spectra of different energy levels (in that order) and multiple energy levels are optional (only one is required). EI spectra only need to have one energy level. Spectra may also be in .msp file format, in which case energy levels for ESI spectra should be specified in the "Comment: " field (EI spectra do not need a specified energy level). A corresponding spectra ID must be selected for .msp spectra. .msp files must have an "ID" and "Num peaks" attributes for each spectra.
| Example peak list format: | low | |
| 87.054687 | 7.567280 | |
| 105.069174 | 1.791050 | |
| 136.07616 | 13.081500 | |
| 160.076289 | 2.225420 | |
| 178.084616 | 5.319120 | |
| 223.106608 | 100.000000 | |
| 251.10173 | 40.722900 | |
| 297.107567 | 3.945980 | |
| 384.140384 | 11.216900 | |
| medium | ||
| 60.044545 | 2.476820 | |
| 87.056965 | 9.632580 | |
| 119.046086 | 2.367850 | |
| 135.066335 | 1.865000 | |
| 136.077192 | 46.373600 | |
| 160.074417 | 6.652730 | |
| 178.08705 | 20.078100 | |
| 223.109344 | 100.000000 | |
| 251.108668 | 3.127750 | |
| 297.113687 | 1.892360 | |
| high | ||
| 42.033909 | 3.047230 | |
| 60.043746 | 26.520300 | |
| 70.027268 | 3.162400 | |
| 87.056272 | 18.342000 | |
| 91.054494 | 23.516200 | |
| 119.04828 | 15.711000 | |
| 121.063402 | 7.273900 | |
| 133.06551 | 5.039960 | |
| 135.066238 | 3.626030 | |
| 136.074907 | 100.000000 | |
| 160.074409 | 26.458000 | |
| 178.085454 | 12.211700 | |
| Example .msp format: | |
| Name: Diazirine | |
| NISTNO: 305841 | |
| ID: ID_3 | |
| Num peaks: 12 | |
| Comment: energy0 | |
| 12 | 108.00 |
| 13 | 228.99 |
| 14 | 999.00 |
| 15 | 21.98 |
| 26 | 17.98 |
| 27 | 58.05 |
| 28 | 178.04 |
| 29 | 22.98 |
| 40 | 17.98 |
| 41 | 108.00 |
| 42 | 431.01 |
| 43 | 7.99 |
| Name: Methane, diazo- | |
| NISTNO: 57 | |
| ID: ID_4 | |
| Num peaks: 12 | |
| Comment: energy1 | |
| 12 | 110.10 |
| 13 | 220.30 |
| 14 | 999.00 |
| 15 | 25.18 |
| 26 | 12.59 |
| 27 | 58.25 |
| 28 | 179.34 |
| 29 | 20.48 |
| 40 | 21.98 |
| 41 | 110.10 |
| 42 | 424.82 |
| 43 | 10.99 |
Spectra Type: The type of spectra, either ESI (Electrospray Ionization) or EI (Electron Ionization/Impact).
Ion Mode: Indicates whether the precursor ion has a positive or negative adduct.
Mass Tolerance: The mass tolerance to use when matching peaks within the dot product comparison. The default value is 10.0 ppm.
Peak Assigment Results:
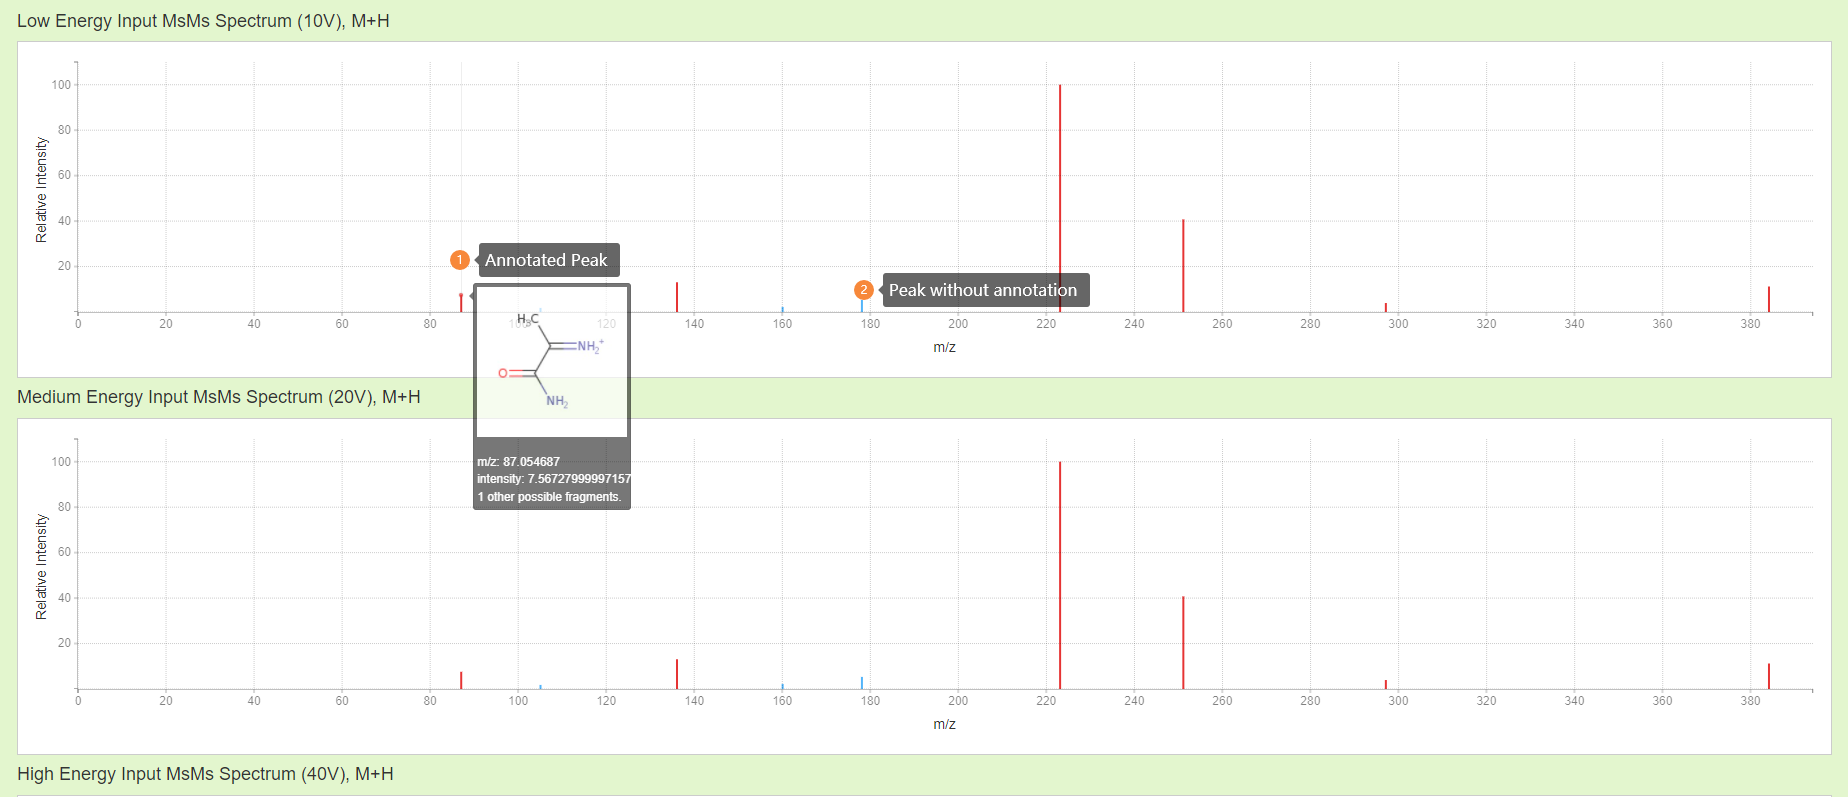
Results: Input spectra are shown in the plot. Peaks for which corresponding fragments have been found are colored red; unassigned peaks are colored blue. Hover over the peaks to see the exact mass and intensity values, along with the highest scoring assigned fragments, if found. More detailed information can be found father down the page. Note that, in the proposed fragment annotations result, the charge is located on an atom. Whilst this may be a true representation of the charged mass fragment, this is not necessarily the case. Currently, CFM-ID determines the charge location by finding a possible solution of electron configuration that 1. Met valence requirements for each atom, 2. Uses exactly the amount of electrons in the fragment. Thus, there will be multiple possible charge locations that meet this requirement, in this case CFM-ID picks the first electron configuration it found.
Compound Identification
The Compound Identification function determines the compounds that most closely match to a given MS/MS spectrum. The input MS/MS spectra (at one or more collision energies) are compared to in silico predicted MS/MS spectra and/or experimental MS/MS spectra as chosen by the user. The top candidates are ranked according to how closely they match and returned in a list. Users may view the matching compounds and their scores in a table and the similarity of the observed spectra to the matched spectra using an MS mirror plot.
Compound Identification Query
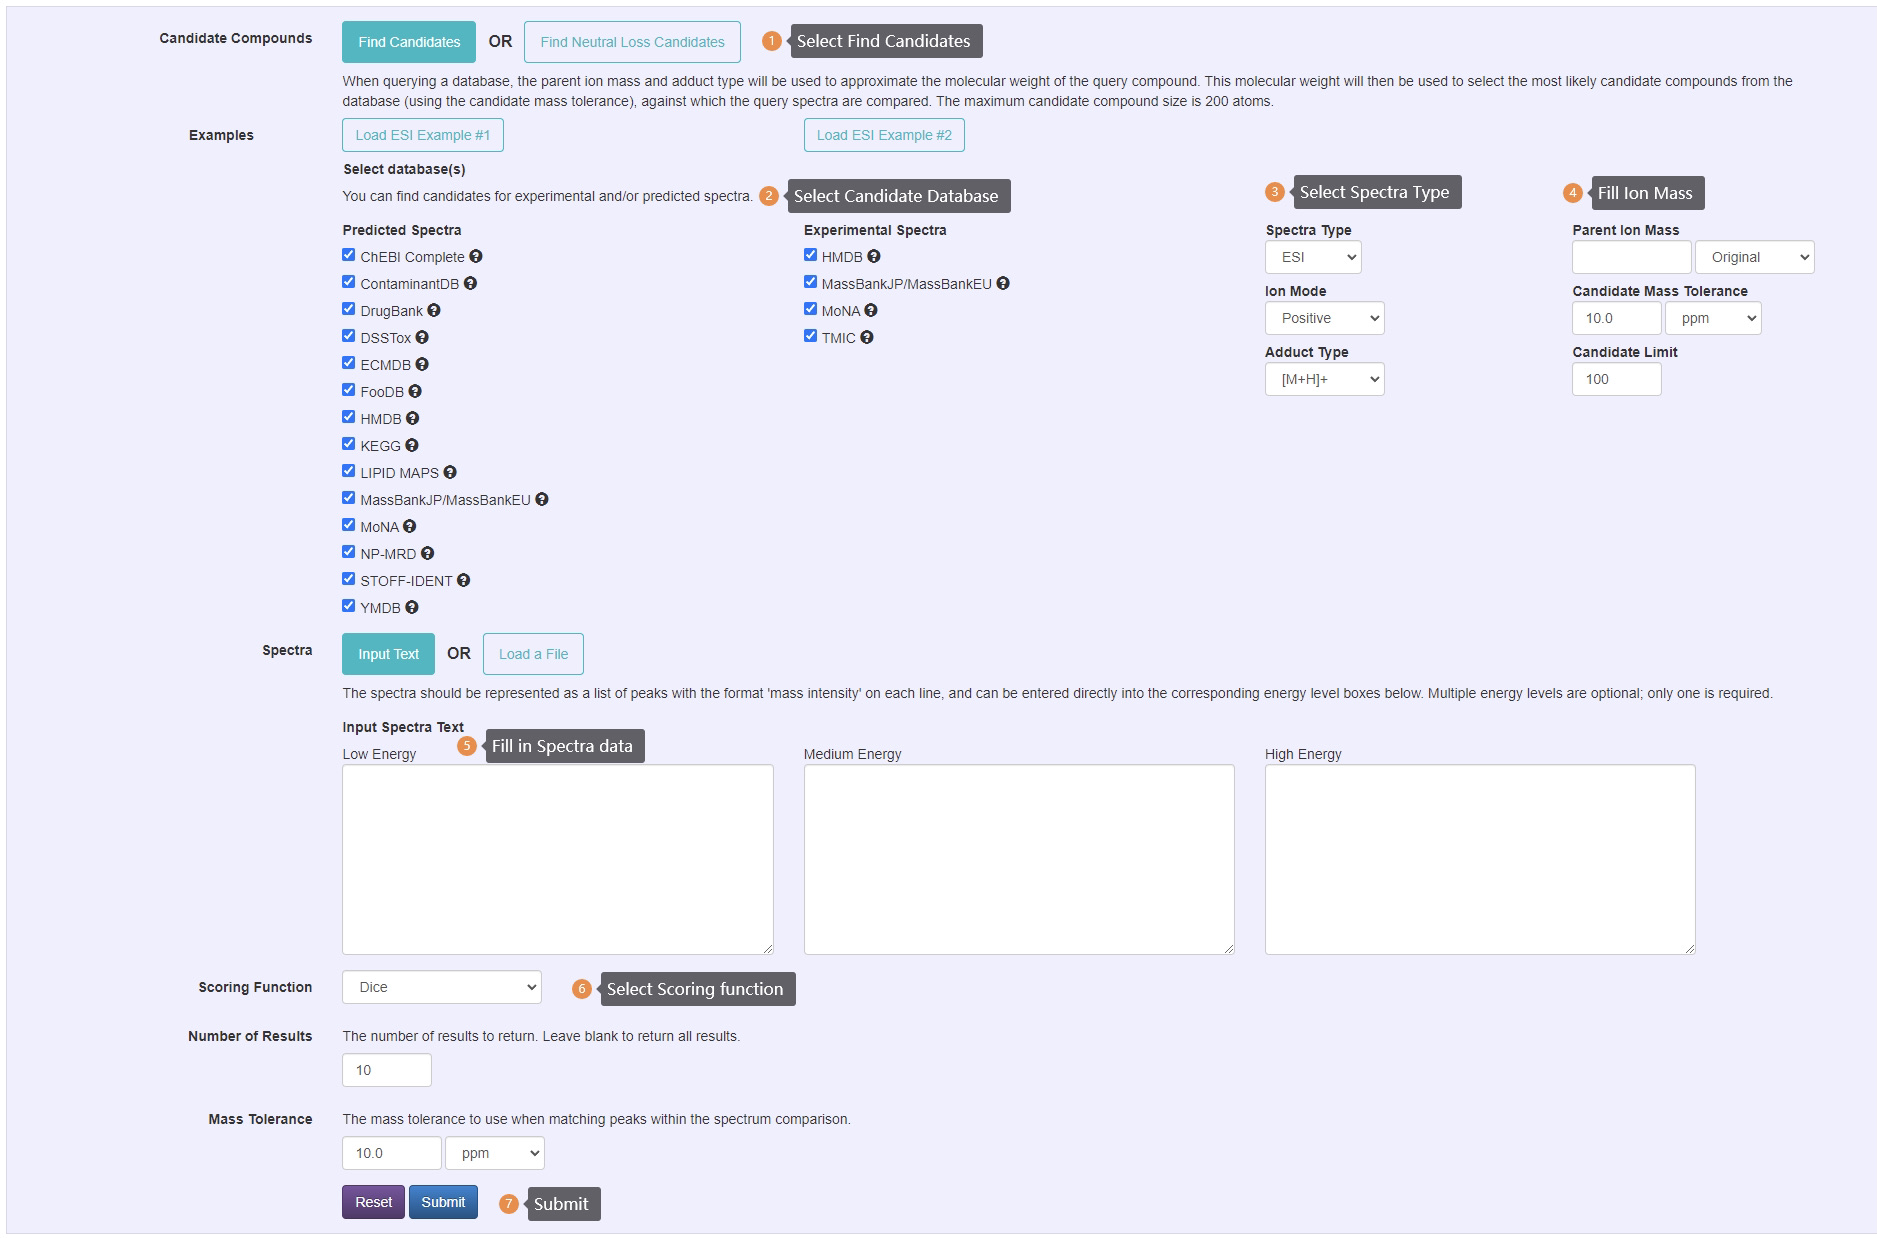
Compound Identification Steps:
- Select find candidate or find neutral loss candidates option. The neutral loss option will allow you to enter a spectrum, then the corresponding neutral loss spectrum will be calculated based off of the parent ion mass.
- Select desired candidate databases. Both experimental and predicted databases are available.
- Select desired spectra type, ion mode and adduct type.
- Enter parent ion information.
- Select mass tolerance for candidates retirive.
- Enter spectra data, the spectra should be represented as a list of peaks with the format 'm/z intensity' on each line. Multiple energy levels are optional; only one is required. This function only accepts centroid spectrum.
- Select scoring function for ranking.
- Select mass tolerance to use when matching peaks within the spectrum comparison.
- Submit job to server
Defitions of Inputs:
Spectra: The spectra should be represented as a list of peaks with the format 'mass intensity' on each line. Only centroided spectrum can be entered. For ESI spectra, 'low','medium', and 'high' or 'energy0', 'energy1', and 'energy2' header lines should begin spectra of different energy levels (in that order) and multiple energy levels are optional (only one is required). EI spectra only need to have one energy level. Spectra may also be in .msp file format, in which case energy levels for ESI spectra should be specified in the "Comment: " field (EI spectra do not need a specified energy level). A corresponding spectra ID must be selected for .msp spectra. .msp files must have an "ID" and "Num peaks" attributes for each spectra.
| Example: | low | |
| 87.054687 | 7.567280 | |
| 105.069174 | 1.791050 | |
| 136.07616 | 13.081500 | |
| 160.076289 | 2.225420 | |
| 178.084616 | 5.319120 | |
| 223.106608 | 100.000000 | |
| 251.10173 | 40.722900 | |
| 297.107567 | 3.945980 | |
| 384.140384 | 11.216900 | |
| medium | ||
| 60.044545 | 2.476820 | |
| 87.056965 | 9.632580 | |
| 119.046086 | 2.367850 | |
| 135.066335 | 1.865000 | |
| 136.077192 | 46.373600 | |
| 160.074417 | 6.652730 | |
| 178.08705 | 20.078100 | |
| 223.109344 | 100.000000 | |
| 251.108668 | 3.127750 | |
| 297.113687 | 1.892360 | |
| high | ||
| 42.033909 | 3.047230 | |
| 60.043746 | 26.520300 | |
| 70.027268 | 3.162400 | |
| 87.056272 | 18.342000 | |
| 91.054494 | 23.516200 | |
| 119.04828 | 15.711000 | |
| 121.063402 | 7.273900 | |
| 133.06551 | 5.039960 | |
| 135.066238 | 3.626030 | |
| 136.074907 | 100.000000 | |
| 160.074409 | 26.458000 | |
| 178.085454 | 12.211700 | |
| Example .msp format: | |
| Name: Diazirine | |
| NISTNO: 305841 | |
| ID: ID_3 | |
| Num peaks: 12 | |
| Comment: energy0 | |
| 12 | 108.00 |
| 13 | 228.99 |
| 14 | 999.00 |
| 15 | 21.98 |
| 26 | 17.98 |
| 27 | 58.05 |
| 28 | 178.04 |
| 29 | 22.98 |
| 40 | 17.98 |
| 41 | 108.00 |
| 42 | 431.01 |
| 43 | 7.99 |
| Name: Methane, diazo- | |
| NISTNO: 57 | |
| ID: ID_4 | |
| Num peaks: 12 | |
| Comment: energy1 | |
| 12 | 110.10 |
| 13 | 220.30 |
| 14 | 999.00 |
| 15 | 25.18 |
| 26 | 12.59 |
| 27 | 58.25 |
| 28 | 179.34 |
| 29 | 20.48 |
| 40 | 21.98 |
| 41 | 110.10 |
| 42 | 424.82 |
| 43 | 10.99 |
Database: Instead of providing a candidate list, one can be generated from a selected database. Additional input options for generating a compound list from a database are:
Parent Ion Mass: The parent ion mass of the compound used in the mass spectrometry.
Adduct Type: The adduct type used in the mass spectrometry.
Candidate Mass Tolerance: The mass tolerance to use when identifying candidate compounds in the database. The default value is 100.0 ppm.
Candidate Limit: The maximum number of candidates to return. The maximum and default value is 100.
Spectra Type: The type of spectra, either ESI (Electrospray Ionization) or EI (Electron Ionization/Impact).
Ion Mode: Indicates whether the precursor ion has a positive or negative adduct.
Number of Results: The number of results to return, with the default value being 10. If left blank, all results wil be returned.
Mass Tolerance: The mass tolerance to use when matching peaks within the dot product comparison. The default value is 10.0 ppm.
Scoring Function: The type of scoring function to use when comparing spectra. The options are Dice and DotProduct.
Compound Identification Results:
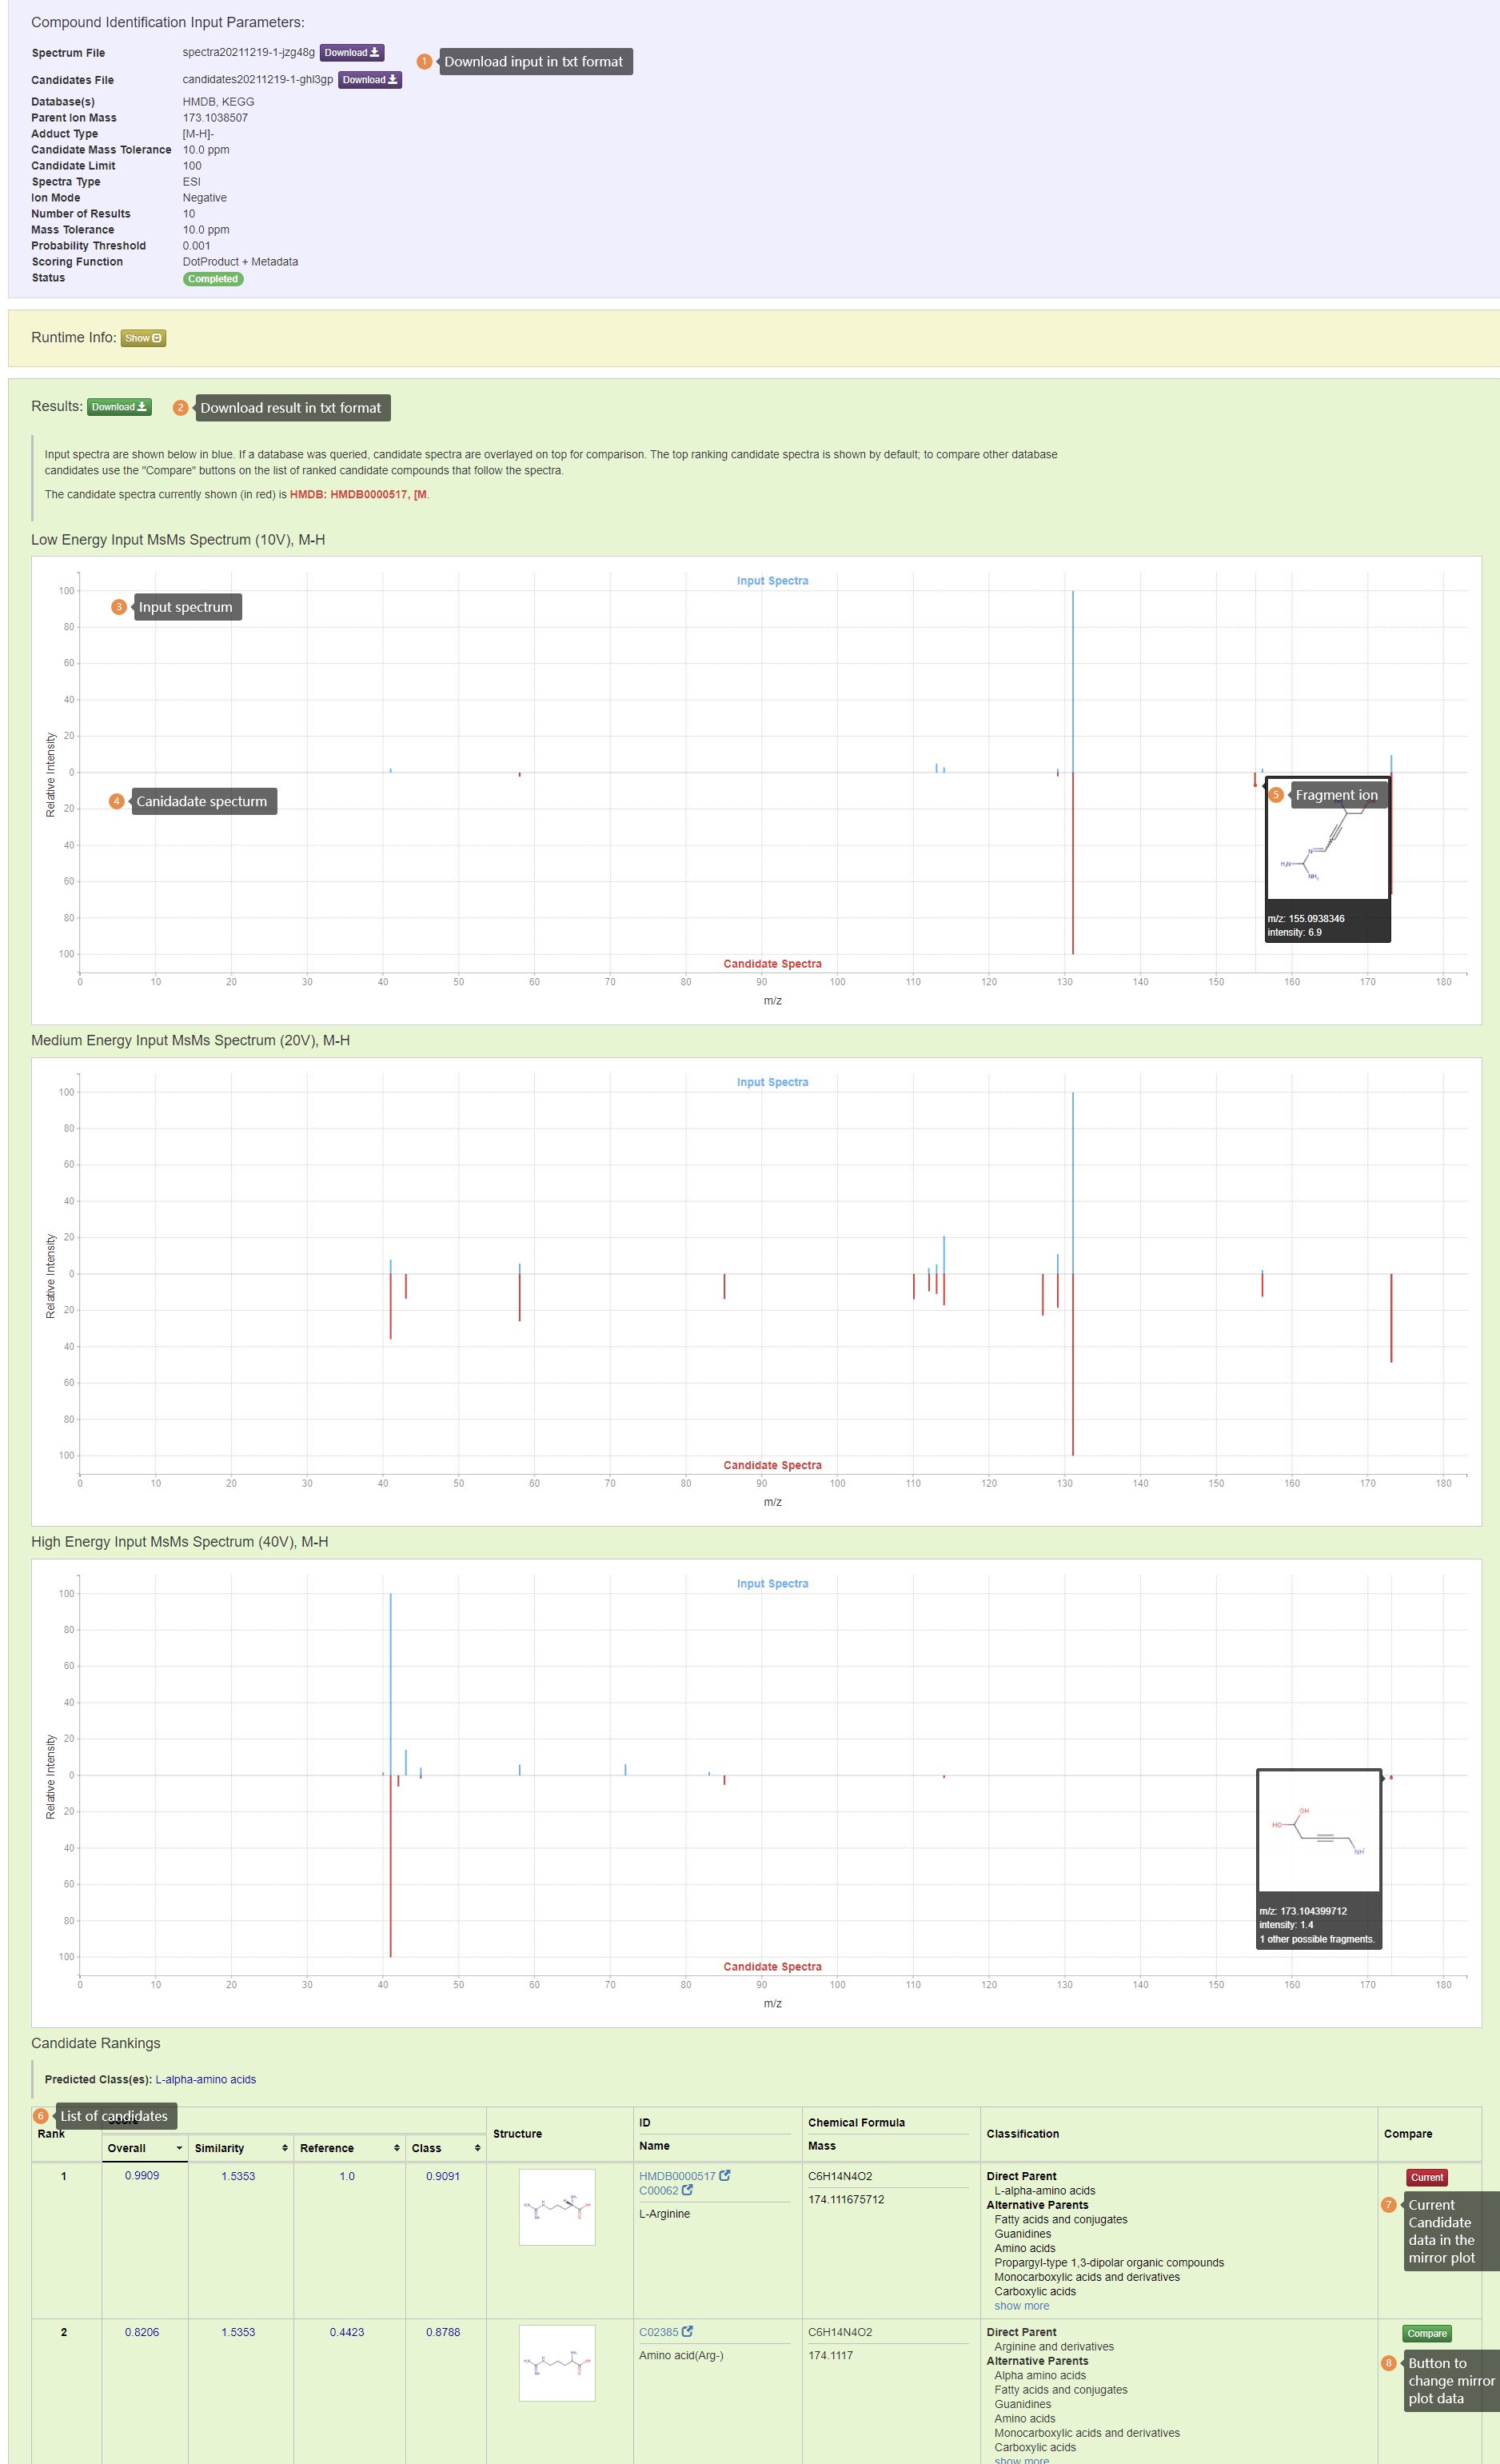
Results: Input spectra are shown in blue and candidate spectra are shown in red. If a database was queried, candidate spectra are overlayed on top for comparison. The top ranking candidate spectra is shown by default; to compare other database candidates use the "Compare" buttons on the list of ranked candidate compounds that follow the spectra.
Browser Compliance
| OS | Version | Chrome | Firefox | Microsoft Edge | Safari |
|---|---|---|---|---|---|
| Linux | Mint 20.1 | 95.0.4638 | 89.0.2 | N/A | N/A |
| MacOS | BigSur 11.6 | 96.0.4664.93 | 95.0.2 | N/A | 14.1.2 (16611.3.10.1.6) |
| Windows | 10 | 96.0.4664.110 | 95.0.1 | 96.0.1054.57 | N/A |
HCD vs CID Spectra
High-energy C-trap dissociation (HCD) is considered a more gentle fragmentation process than CID, that is an HCD spectrum typically has more unique fragments across the entire mass-to-charge ratio range than their CID counterparts. However, for the same molecule, CID and HCD spectra in similar collision energy are having a lot of fragments in common. Recall that CFM-ID is trained on CID data, thus its predicted spectra are less similar to Orbitrap spectra than QToF spectra (Yields lower Dice or/and Dot Product score). From our experience, CFM-ID predicted spectra are still very useful to determine compounds with Orbitrap data. In the CASMI 2016 experiments, we first determine the true collision energy of a given spectrum from its NCE value by the equation provided by Thermo Fisher, then compared this spectrum with the closest CID collision energy spectra.
Performance
Compound-to-Spectra Prediction Performance
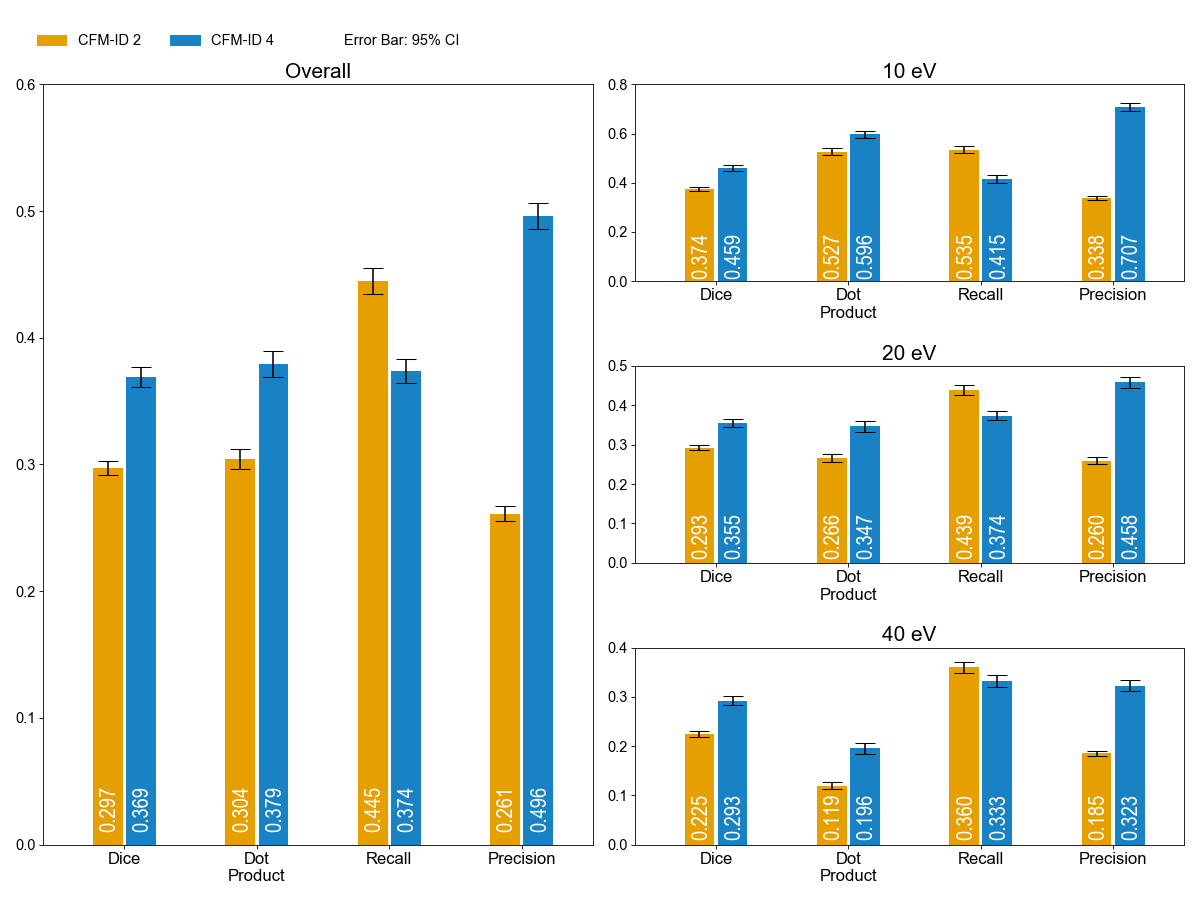
Figure 1.Spectrum prediction results for the Metlin 2015 dataset in [M+H]+. Each bar displays mean scores for its metrics with an error bar indicates the 95% confidence interval. The plot on the left presents the overall performance of the model, and plots on the right provide the performance measures for each collision energy.
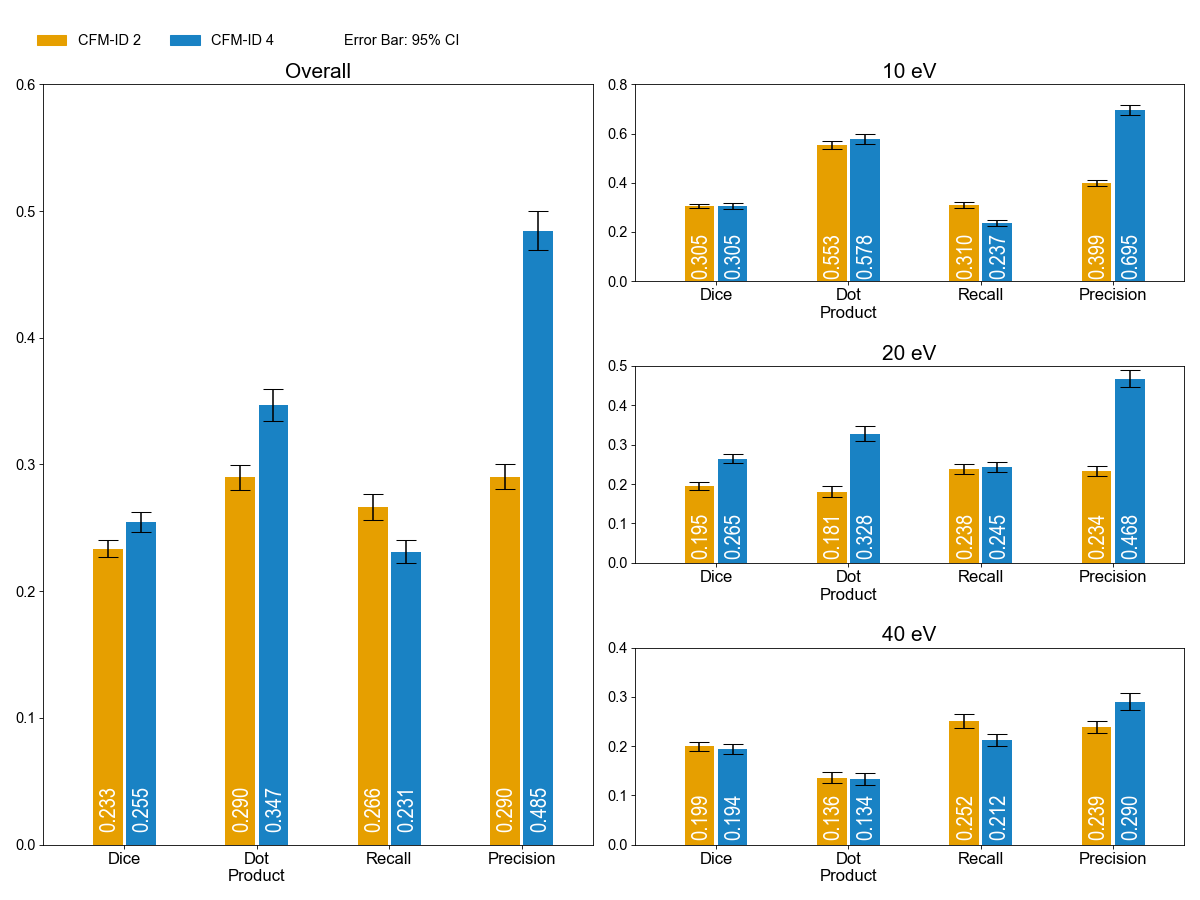
Figure 2.Spectrum prediction results for the Metlin 2015 dataset in [M-H]-. Each bar displays mean scores for its metrics with an error bar indicates the 95% confidence interval. The plot on the left presents the overall performance of the model, and plots on the right provide the performance measures for each collision energy.
| Superclass | Dice | Dot Product | Recall | Precision | Count |
|---|---|---|---|---|---|
| Hydrocarbons | 0.474 | 0.259 | 49.3 | 57.1 | 2 |
| Organic 1,3-dipolar compounds | 0.465 | 0.703 | 43.1 | 69.4 | 1 |
| Organic nitrogen compounds | 0.43 | 0.454 | 50.8 | 50.8 | 124 |
| Nucleosides, nucleotides, and analogues | 0.418 | 0.53 | 51.5 | 48.9 | 73 |
| Organosulfur compounds | 0.405 | 0.364 | 43.7 | 54.9 | 18 |
| Organic acids and derivatives | 0.399 | 0.382 | 48.5 | 43.3 | 481 |
| Lipids | 0.394 | 0.417 | 52.2 | 42.6 | 33 |
| Organoheterocyclic compounds | 0.384 | 0.414 | 40.4 | 51 | 988 |
| Alkaloids and derivatives | 0.377 | 0.471 | 42.5 | 47.3 | 90 |
| Phenylpropanoids and polyketides | 0.367 | 0.427 | 37.5 | 51 | 382 |
| Benzenoids | 0.358 | 0.367 | 42.5 | 44 | 797 |
| Lipid-like molecules | 0.358 | 0.313 | 37.8 | 45.7 | 827 |
| Organic oxygen compounds | 0.346 | 0.298 | 40.5 | 41.5 | 223 |
| Organophosphorus compounds | 0.33 | 0.207 | 27.2 | 51.4 | 4 |
| Lignans, neolignans and related compounds | 0.242 | 0.217 | 31 | 28.4 | 11 |
| Organometallic compounds | 0.227 | 0.22 | 16.8 | 42.8 | 2 |
| Hydrocarbon derivatives | 0.208 | 0.248 | 22.2 | 33.9 | 5 |
| Acetylides | 0.095 | 0.001 | 11.1 | 8.3 | 1 |
Table 1. Average (over all three energy levels) performance metrics based on chemical classes of the training set in ESI positive mode.
| Superclass | Dice | Dot Product | Recall | Precision | Count |
|---|---|---|---|---|---|
| Lipids | 0.387 | 0.451 | 48.2 | 42.4 | 15 |
| Organic acids and derivatives | 0.348 | 0.364 | 38.1 | 45.4 | 335 |
| Organosulfur compounds | 0.322 | 0.329 | 29.9 | 49.2 | 4 |
| Nucleosides, nucleotides, and analogues | 0.314 | 0.373 | 40.5 | 39.9 | 60 |
| Lipid-like molecules | 0.310 | 0.366 | 37.0 | 42.4 | 428 |
| Organic oxygen compounds | 0.301 | 0.272 | 32.1 | 42.2 | 84 |
| Organoheterocyclic compounds | 0.300 | 0.351 | 29.8 | 50.5 | 485 |
| Benzenoids | 0.297 | 0.318 | 31.3 | 44.2 | 402 |
| Phenylpropanoids and polyketides | 0.287 | 0.339 | 26.9 | 48.8 | 231 |
| Alkaloids and derivatives | 0.277 | 0.263 | 25.1 | 46.3 | 20 |
| Organic nitrogen compounds | 0.254 | 0.233 | 31.9 | 30.7 | 30 |
| Hydrocarbon derivatives | 0.232 | 0.331 | 14.8 | 58.6 | 1 |
| Lignans, neolignans and related compounds | 0.205 | 0.285 | 19.7 | 27.0 | 6 |
| Organometallic compounds | 0.145 | 0.100 | 11.0 | 30.6 | 1 |
| Organophosphorus compounds | 0.131 | 0.070 | 8.5 | 42.9 | 1 |
| Organometallic compounds | 0.227 | 0.22 | 16.8 | 42.8 | 2 |
| Hydrocarbon derivatives | 0.208 | 0.248 | 22.2 | 33.9 | 5 |
| Acetylides | 0.095 | 0.001 | 11.1 | 8.3 | 1 |
Table 2. Average (over all three energy levels) performance metrics based on chemical classes of training set in ESI negative mode.
Domian Specific Performance
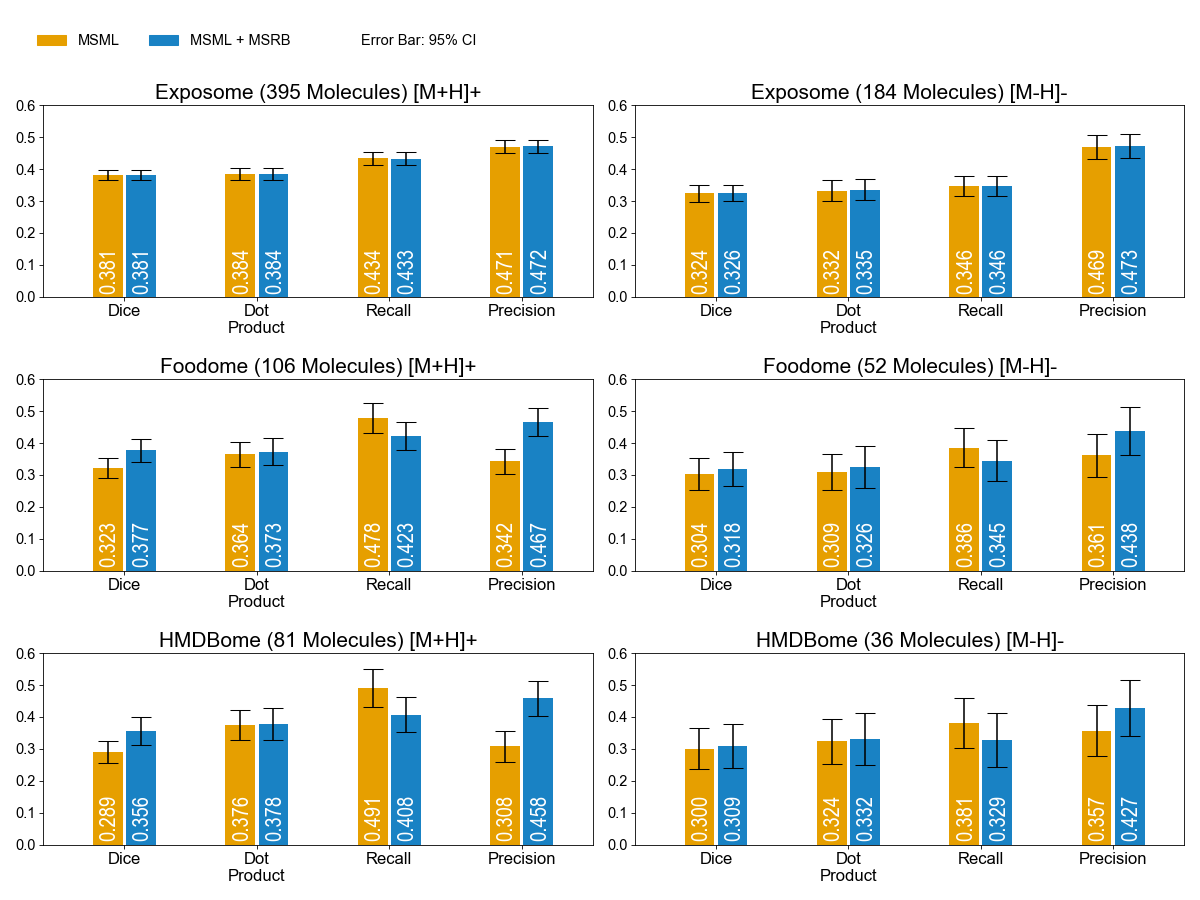
Figure 3. Spectrum prediction results for the Exposome, Foodome, and HMDBOopme in [M+H]+ and [M-H]-. Each bar displays mean scores for its metrics with an error bar indicates the 95% confidence interval.
Spectra-to-Compound Identification Performance
| Version | # Top 1 | # Top 3 | # Top 10 |
|---|---|---|---|
| CFM-ID 2.0 + Candidate Database | 120 | 160 | 182 |
| CFM-ID 2.0 + Candidate Database + Experimental Spectra | 123 | 171 | 201 |
| SIRIUS 4 + CSI:FingerID | 138 | N/A | 186 |
| MS-Finder | 146 | 162 | 174 |
| CFM-ID 3.0 + Candidate Database + Experimental Spectra + Meta Data | 149 | 194 | 204 |
| CFM-ID 4.0 + Candidate Database | 147 | 178 | 203 |
| CFM-ID 4.0 + Candidate Database + Meta Data | 162 | 186 | 204 |
Table 3. Comparison of CFM-ID 4.0, CFM-ID 3.0, CFM-ID 2.0, MS-FINDER, and SIRIUS 4 compound identification Performance on CASMI 2016 contest (category 3).Reported are the total number of challenges in which the corresponding implementation of the scoring function ranked the query compound in the top 1, top 3, and top 10. **CFM-ID 4.0 + Candidate Database + Meta Data** is the method provided in this web server.
Docker Image
What is Included?
- Latest CFM-ID 4 MSML machine learning model
- C++ Runtime for CFM-ID 4 MSML
- Latest CFM-ID 4 MSRB rule based extension
- Java Runtime for CFM-ID 4 MSRB
What is not Included?
- CFM-ID in-silico spectra libaray
- CFM-ID experimental spectra libaray
What can it do?
- Predict spectra for give molecule structure
- Annotate spectrum for given moleucle structure and its spectrum
- Idenity molecule from a given spectrum and user provided candidate list
How to use it?
Please refer to the user guide on DockerHub page.